Earthquake Increase
While the USGS frantically works to keep the public from being aware of the increase in earthquakes, there
are limits to how far the cover-up can go.
Question: As of late, I have observed that USGS and EMSC are a bit lax on their
reports of earthquakes. Sometimes not seeing anything reported for hours from the last
update, or seeing periods of 90-200 minutes with no earthquakes in between. My
question is, are they leaving swarms of earthquakes out of their reports, or there are
actually periods of no earthquakes?
ZetaTalk Answer 8/7/2010: Greater than 90% of the earthquake activity is being altered by the USGS
at present, which is under orders to prevent any clue being given to the public about the Earth changes
caused by the presence of Planet X. Over a decade ago, the approach was to de-sensitize the live
seismographs periodically, so the displays do not turn black worldwide, and to ignore the twice-a-day
patterns showing up on these seismographs. Then any quakes that could be dropped were dropped.
This was obvious to some who were watching the database manipulation. Quakes in the list would
suddenly disappear. This was particularly the case where a quake happened in a remote location, or
out in the ocean. Dumbing down the magnitude quickly followed, but in order to ensure the public did
not notice, the USGS took control of all websites reporting quake statistics. At times, this control
breaks, and discrepancies are reported to the public. Some countries rebel. Quake swarms are another
source of control, as they pepper the databases with many quakes and skew the statistics, and thus are
pulled from the database. Else the question is raised, why so many?
Despite the coverup, the rise in earthquakes is apparent. These charts, secured from the Lindquist Research
site show the rise in quakes 6+, 7+, and 8+ during 1973 to the present year of 2010.
Certainly, quake since 1973 graphed geographically show the fault lines, and where the increase in quakes can
be expected to hit.
Blooming Planets
Blooming is an astrophysics term describing the effect when light is attracted to a planetary body or star as it
passes, so that it bends toward that planetary body or star and thus, in the view from Earth, appears to be
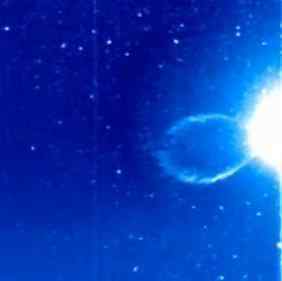
brighter than would otherwise be the case. Lately, due to the presence of Planet X, both Venus and Jupiter
have appeared to bloom in SOHO images or photos. Venus developed a bubble that pulled toward the Sun
and then popped, on the Stereo Behind images. Per the Zetas, this was a result of light blooming, as Venus
stood between Planet X and the Stereo Behind satellite.
VIDEO: Bubble Popping
ZetaTalk Explanation 8/7/2010: Venus has been pushed back and forth in front of the Earth to simulate
its orbit for earthlings viewing Venus, for some years. Ever since Planet X arrived in the inner solar
system in 2003, and Venus, as the Earth and her Dark Twin, came round in their orbits to encounter
Planet X standing before them. We have stated that maintaining the Element of Doubt is done so that
the establishment on Earth does not panic and start mowing the common man down in the streets. As
they have begun retreating to their bunkers, leaving their political and corporate positions, the truth
can gradually be revealed. Thus, we have hinted of late that Venus may not be where expected.
Certainly as Earth's sister planets re increasingly squeezed in the cup with the Earth, these planets can
be expected to loom large and then eventually escape the cup altogether. This time has not yet arrived.
Is the odd flare from Venus on the Stereo Behind images related to these relaxed rules? These images
from Stereo Behind are taken from the stereo satellite that rides behind the Earth in her orbit, and thus
is pointed in the direction of Planet X which is coming at the Earth in a retrograde manner, from the
right. Thus, these flares are nothing more than the blooming effect which is sometimes seen in
astronomy, where light bends toward a gravity sink, and adds to the appearance of light coming from
that gravity sink.
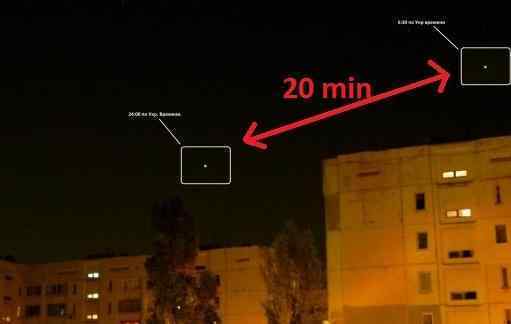
Jupiter also had a blooming effect in a photo from Sevastopol in the Ukraine. Coincidentally, the series of
photos taken also showed Jupiter making a huge leap to the right within a 20 minute period - a capture of the
Earth wobble on film! At this time of night, Jupiter would be seen in the SE, so the camera was facing in the
direction where Planet X would be, just over the eastern horizon.
My friend has photographed interesting object in the sky. It was in Sevastopol, Ukraine.
The photo is made on the good camera with 30X zoom. According to program
Stellarium, there there could be only Jupiter. Venus was not visible. This too bright and
too big to be Jupiter. For 20 minutes the object has strongly moved. What is it? The
camera has been directed on the East. Time approximately midnight 0:00 (Sevastopol) -
10:00 PM (Greenwich). In this place there could be only Jupiter. But it could not be
such bright and big. 30X it is not enough approach that Jupiter was such size!
ZetaTalk Explanation 8/7/2010: This is Jupiter, with the blooming effect noted also for Venus on the
Stereo Behind images recently. The photographer was looking to the SE, as dawn approached, thus
looking toward Planet X. Blooming is where light from a distant object (Jupiter) is bent toward a
gravity source (Planet X). This intensifies light from the distant object as the light rays are bent and
bunched as they pass that gravity source. But the real story is not the blooming, but the sudden
movement of Jupiter across the night sky! Caught on film, the Earth wobble!
Crop Circle Comparison
Crop circle progression, where a new crop circle is similar to one laid years ago or days earlier, have been
showing up increasingly. We noted that in Issue 194 when the Serpentine Dance that had been in place since
early 2004 was to end in 2010. Here a crop circle from 2003 was compared to a recent 2010 circle
formation.

Now another comparison to a crop circle laid in Saskatchewan on Aug 8, 2003 to one laid in Winters in the
UK on August 2, 2010. Per the Zetas, this is an overview, as 2003 was the year Planet X arrived in our inner
solar system, and now in 2010 it is outbound.
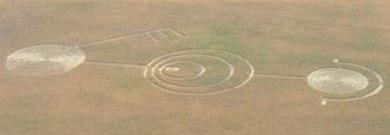
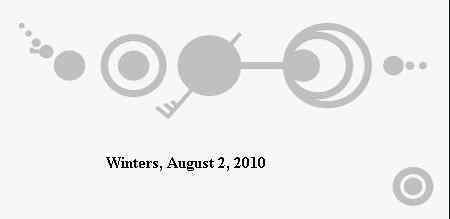
ZetaTalk Analysis 8/7/2010: Comparing these two very similar crop circles, one can see the
progression. In Saskatchewan on August 8, 2003, Planet X had arrived at the Sun, but was at the
opposite side from the Earth, whereas in Winters on August 2, 2010 it is outbound, moving away from
Sun. Which pole Planet X is pointing at the Sun can be seen in the key insignia. The N Pole is pointing
AT the Sun in 2003 but away from it in 2010. The Sun's ability to buffer the Earth from the magnetic
effects of Planet X can also be seen, in that in 2003 there are 3 rings around the Sun insignia, shown
as leaning slightly towards Planet X, but in 2010 there are only two rings. The portion of Planet X's
magnetic influence that the Sun cannot buffer is seen as broken out, in front of Planet X as a single
ring. This is what is bombarding Earth at present.
Another recent crop circle in Italy, laid on June 29, 2010, shows this inbound/outbound path clearly, in a
single crop circle.
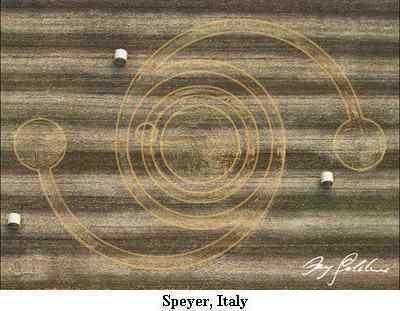
ZetaTalk Analysis 8/7/2010: For Speyer in Italy, this is a depiction of the passage, in short form. The
slinging orb on either side is Planet X, first as it entered the solar system in 2003 with its retrograde
orbit, and on the left as it leaves. The Earth found herself on the opposite side of Planet X in the spring
of 2003, but for the passage the hapless Earth will be on the same side. Technically speaking, Planet X
is closer to the Sun while it creeps past on its way outbound, but for this crop circle, which is a short
form, the depiction is inbound/outbound end of story.
We noted that in Issue 196 where the new wobble pattern that developed during July showed a progression
over the month.
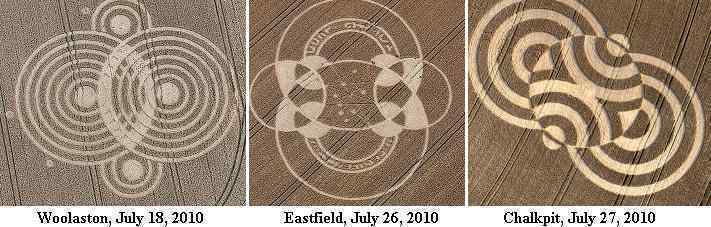
A single crop circle laid in Eartfield shows progression within days, and is still building! Per the Zetas, this is
showing the effect of the changed wobble pattern that occurred in July, 2010. It is a daily increase in the
rattling effect, and is building!
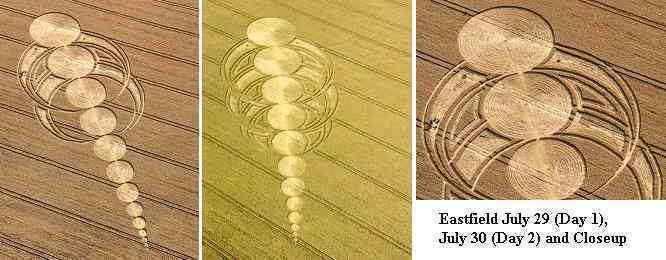
ZetaTalk Analysis 7/31/2010: Despite claims that this crop circle is fake, it is genuine. Thefts from cars
and false donation boxes have inspired the cries of a fraud, in an attempt to keep people from a field
not closely watched and clearly a trap for the unwary. What does the progression of overlapping orbs
represent? It is a growth, in a day, not only of the encircling reach of the top orbs, but of the size of the
orbs themselves. This pictorially represents what we have been trying to relay regarding the new Earth
wobble, which we will now start called the Earth rattle. The Earth moves in several directions at once,
or in quick succession, jerking back and forth to meet often conflicting directives from the frantic
magnetic field of Earth which is likewise trying to meet quickly changing directives from the dominant
magnetic field of Planet X. The encircling reach represents a change from where the Earth had been
only moments before, so that the past affects the future. The Earth may be in the middle of her usual
Figure 8 wobble pattern and suddenly get pushed into opposition, for instance. The force and
frequency of this type of rattling of the Earth will continue to increase.
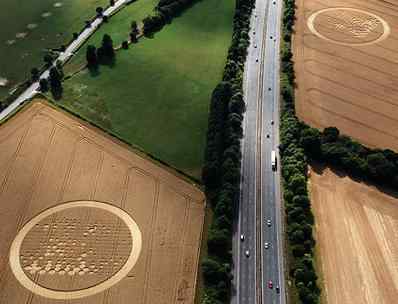
We noted the heatwaves assaulting the northern hemisphere in Issue 194. Now a crop circle duet that seems
to be referencing these heatwaves has appeared in Wickham Green on July 30, 2010.
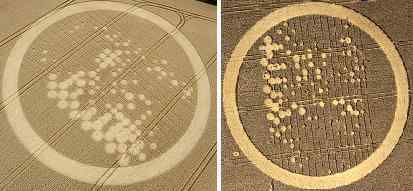
Someone on the Pole Shift ning noted a heatwave correlation or at least a similar appearance.
Could this be referring to the current heatwaves, at least in part, and the lines referencing latitude lines? Per the
Zetas, this, and more is inferred. The angle and tilt of the duet vs a vs each other also has significance. Our
weather is going to get very lively!
ZetaTalk Analysis 8/7/2010: As tempting as it may be to align these two crop circles with the current
heat wave pattern, this is not the sole message. Note that one of the circles is laid across the tram
lines, but the other is laid at an angle across the tran lines, nor are either of these fields arranged so
that their tram lines are parallel to each other. All this is not by accident. We have spoken of the daily
wobble being affected by temporary leans to the left and leans into opposition, all amidst the daily
wobble and quickly switching about. This will of course affect the heatwaves that have beset the
northern hemisphere this past summer. Are the lines on the circles equivalent to attitude lines? They
count 16 lines in both cases, in both circles. If the center one is the Equator, and the large circles to be
interpreted as heatwave centers, then this would place the heatwaves at latitude 70! At present, this is
not the case. Could matters go to this extreme, at least for hours of daylight during a tense lean into
opposition where these upper latitudes were baked in direct exposure to the Sun for long hours? This is
what is being implied here. Why are the circles not parallel to each other, nor even evenly crossing the
tram lines? If you look at both together, as they are laid, you can see the degree a wobble might take
during such an extreme mixed back where leans to the left and into opposition are combined with the
current Figure 8 of a daily wobble. This is a 45° variance! And all this is not the anticipated severe
wobble which will lead into the last weeks. This is just the Earth changes, escalating!
You received this Newsletter because you Subscribed to the ZetaTalk Newsletter service. If undesired, you can quickly
Unsubscribe. You can always access prior Newsletters from the Archives.
|